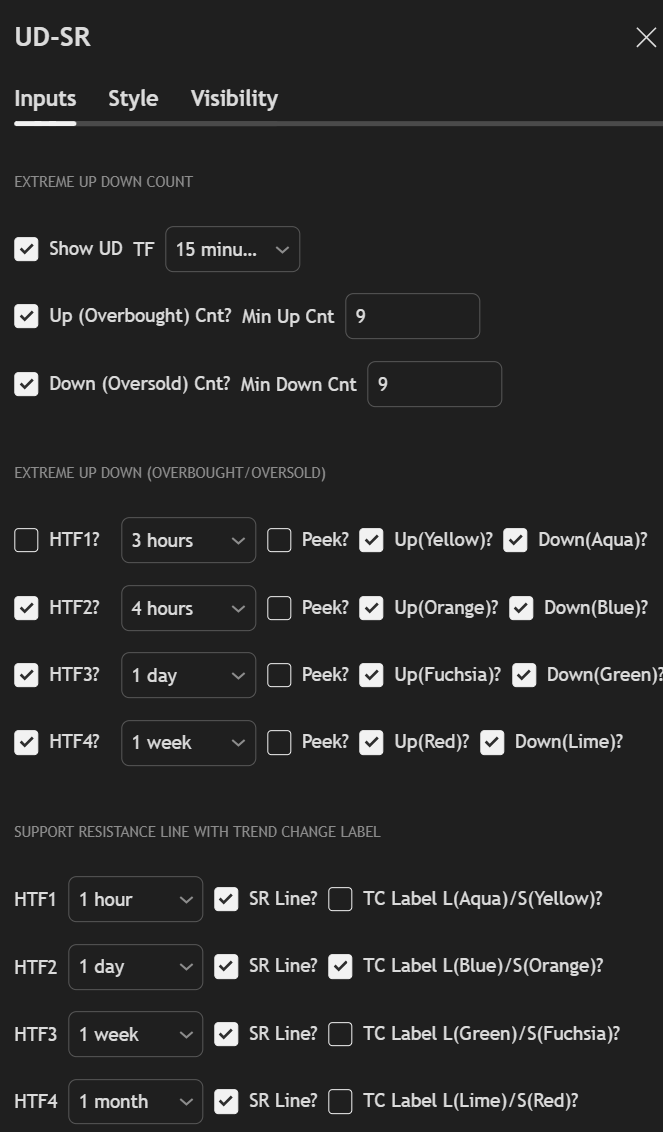
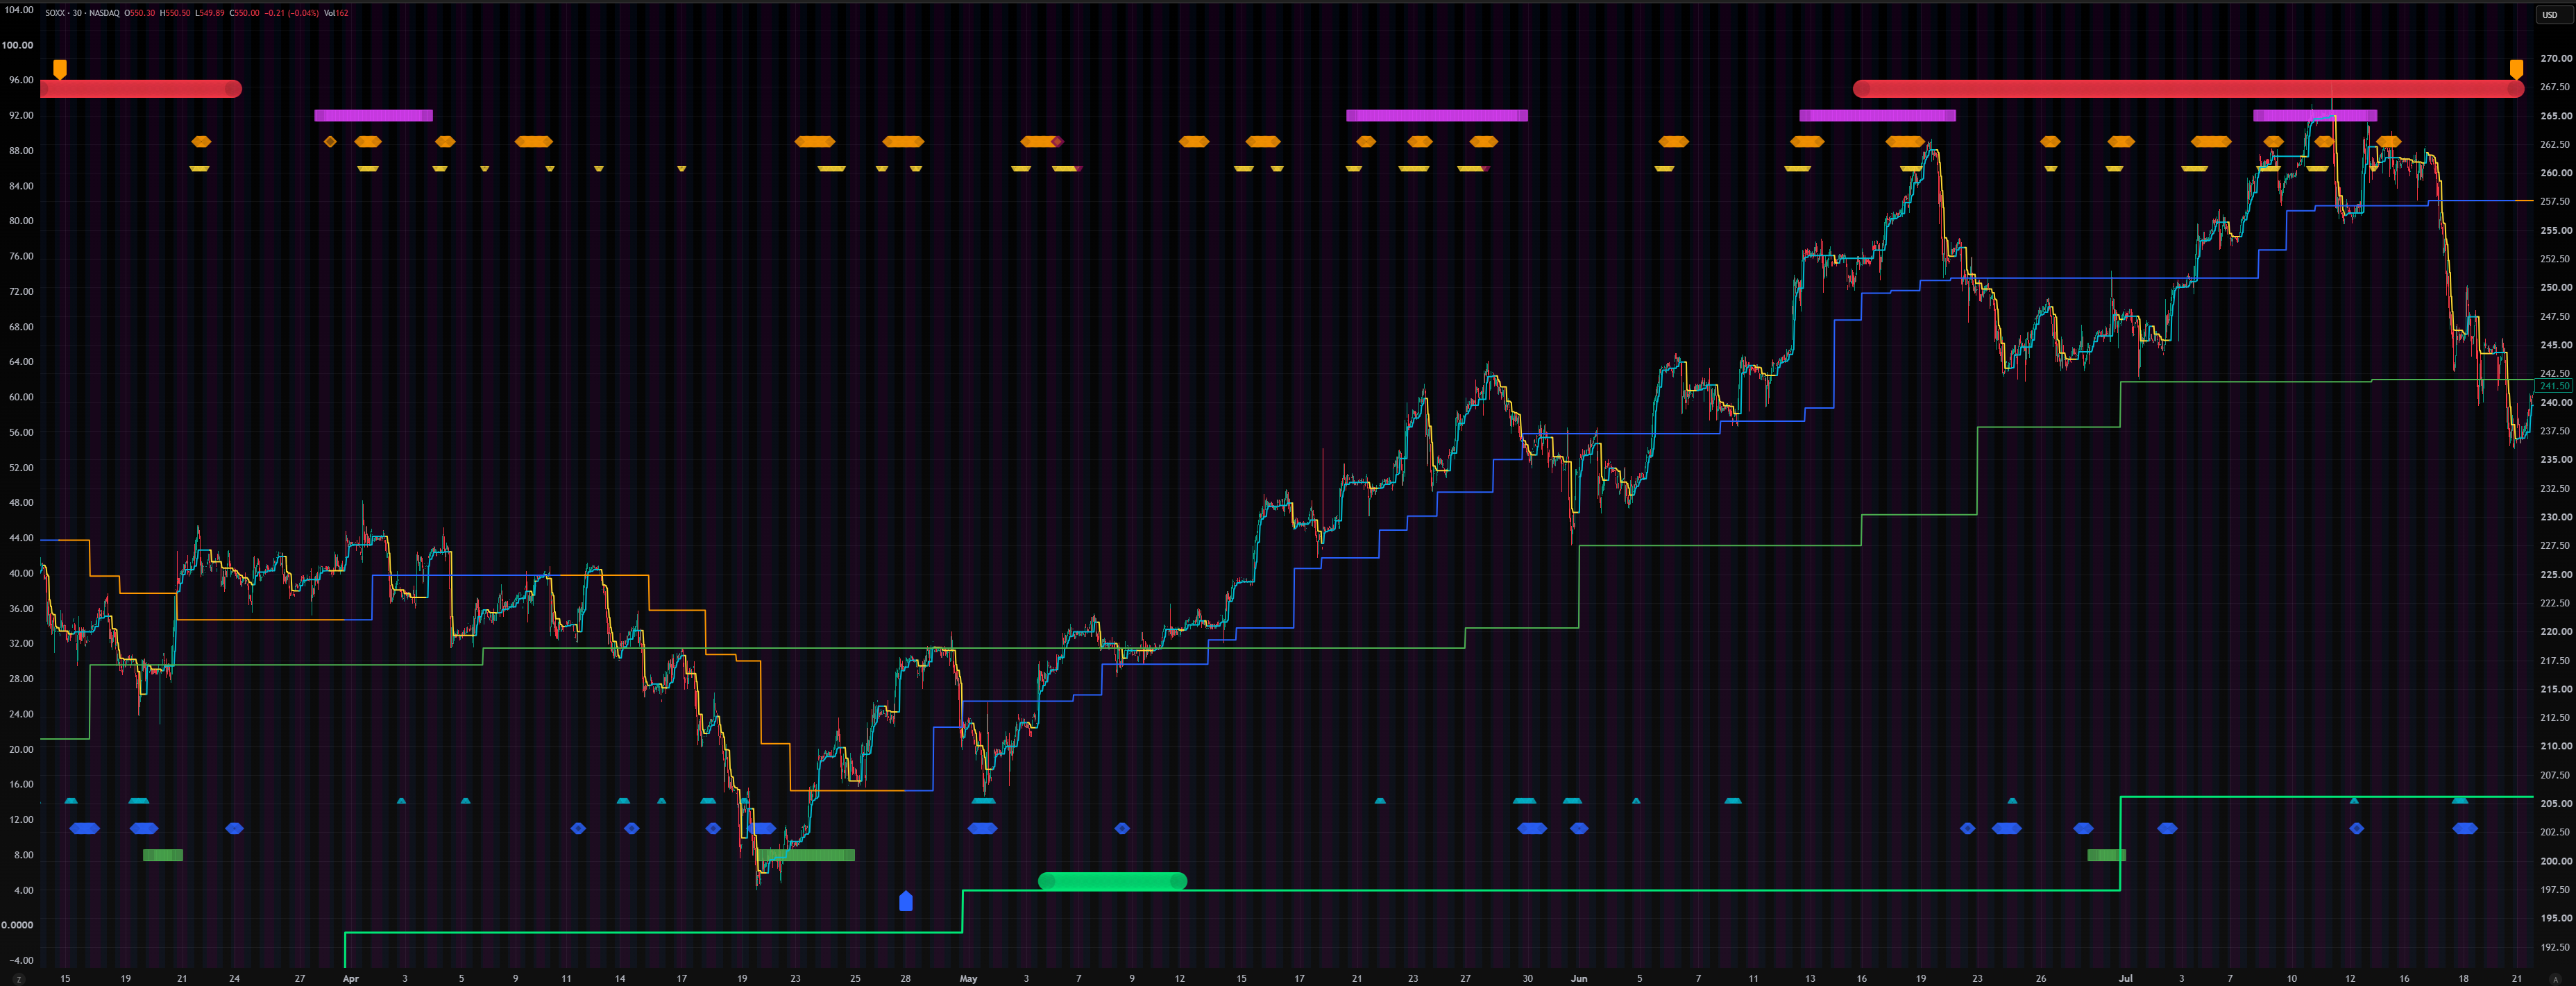
The market can be in one of 3 different directions, determined by UD, SR LINE, and TC
LABEL in the UD-SR indicator:
- Downtrend
- Sideways
- Uptrend
By manually grading the 1W/1D/4H FVGs, Suspension Blocks, and
iFVGs found in the GP-BLK indicator into quadrants and octants, and
evaluating the price action around those quadrants and octants, one can frequently pinpoint the turning
point of a new market direction.
Downtrend Market
In a downtrend market, we will see more
- 4H UD Triangles
- 1D UD Squares
- 1W UD Circles
than
- 4H UD Triangles
- 1D UD Squares
- 1W UD Circles
The stronger the trend, the greater the differences become.
Sequence of Direction Change to Downtrend Market in Higher Timeframes
- Price crosses below 1W SR Line: an early indication that
could flip-flop a lot. This acts as a trailing stop for the long position in a swing trade.
- 1D SR Line crosses below 1W SR
Line: an early indication that could be reversed by the opposing crossover, starting
another leg of the uptrend.
- 1D TC Label appears: an early indication that could be reversed
by the opposite 1D TC Label, starting another leg of the uptrend.
- Price crosses below 1M SR Line: an indication that the current
uptrend is ending, but this could be reversed if price quickly crosses back above it.
- Color changes from 1W SR Line to 1W
SR Line: an indication that a severe downtrend is developing, which frequently lasts until
1W UD Circles appear.
- Color changes from 1M SR Line to 1M SR
Line: an indication that a very severe downtrend is developing, which frequently lasts until
multiple groups of 1W UD Circles appear.
- During a downtrend, the 1W SR Line and 1M SR Line become strong
resistance lines, and price often cannot cross above them. They often act as good entry
levels for short positions.
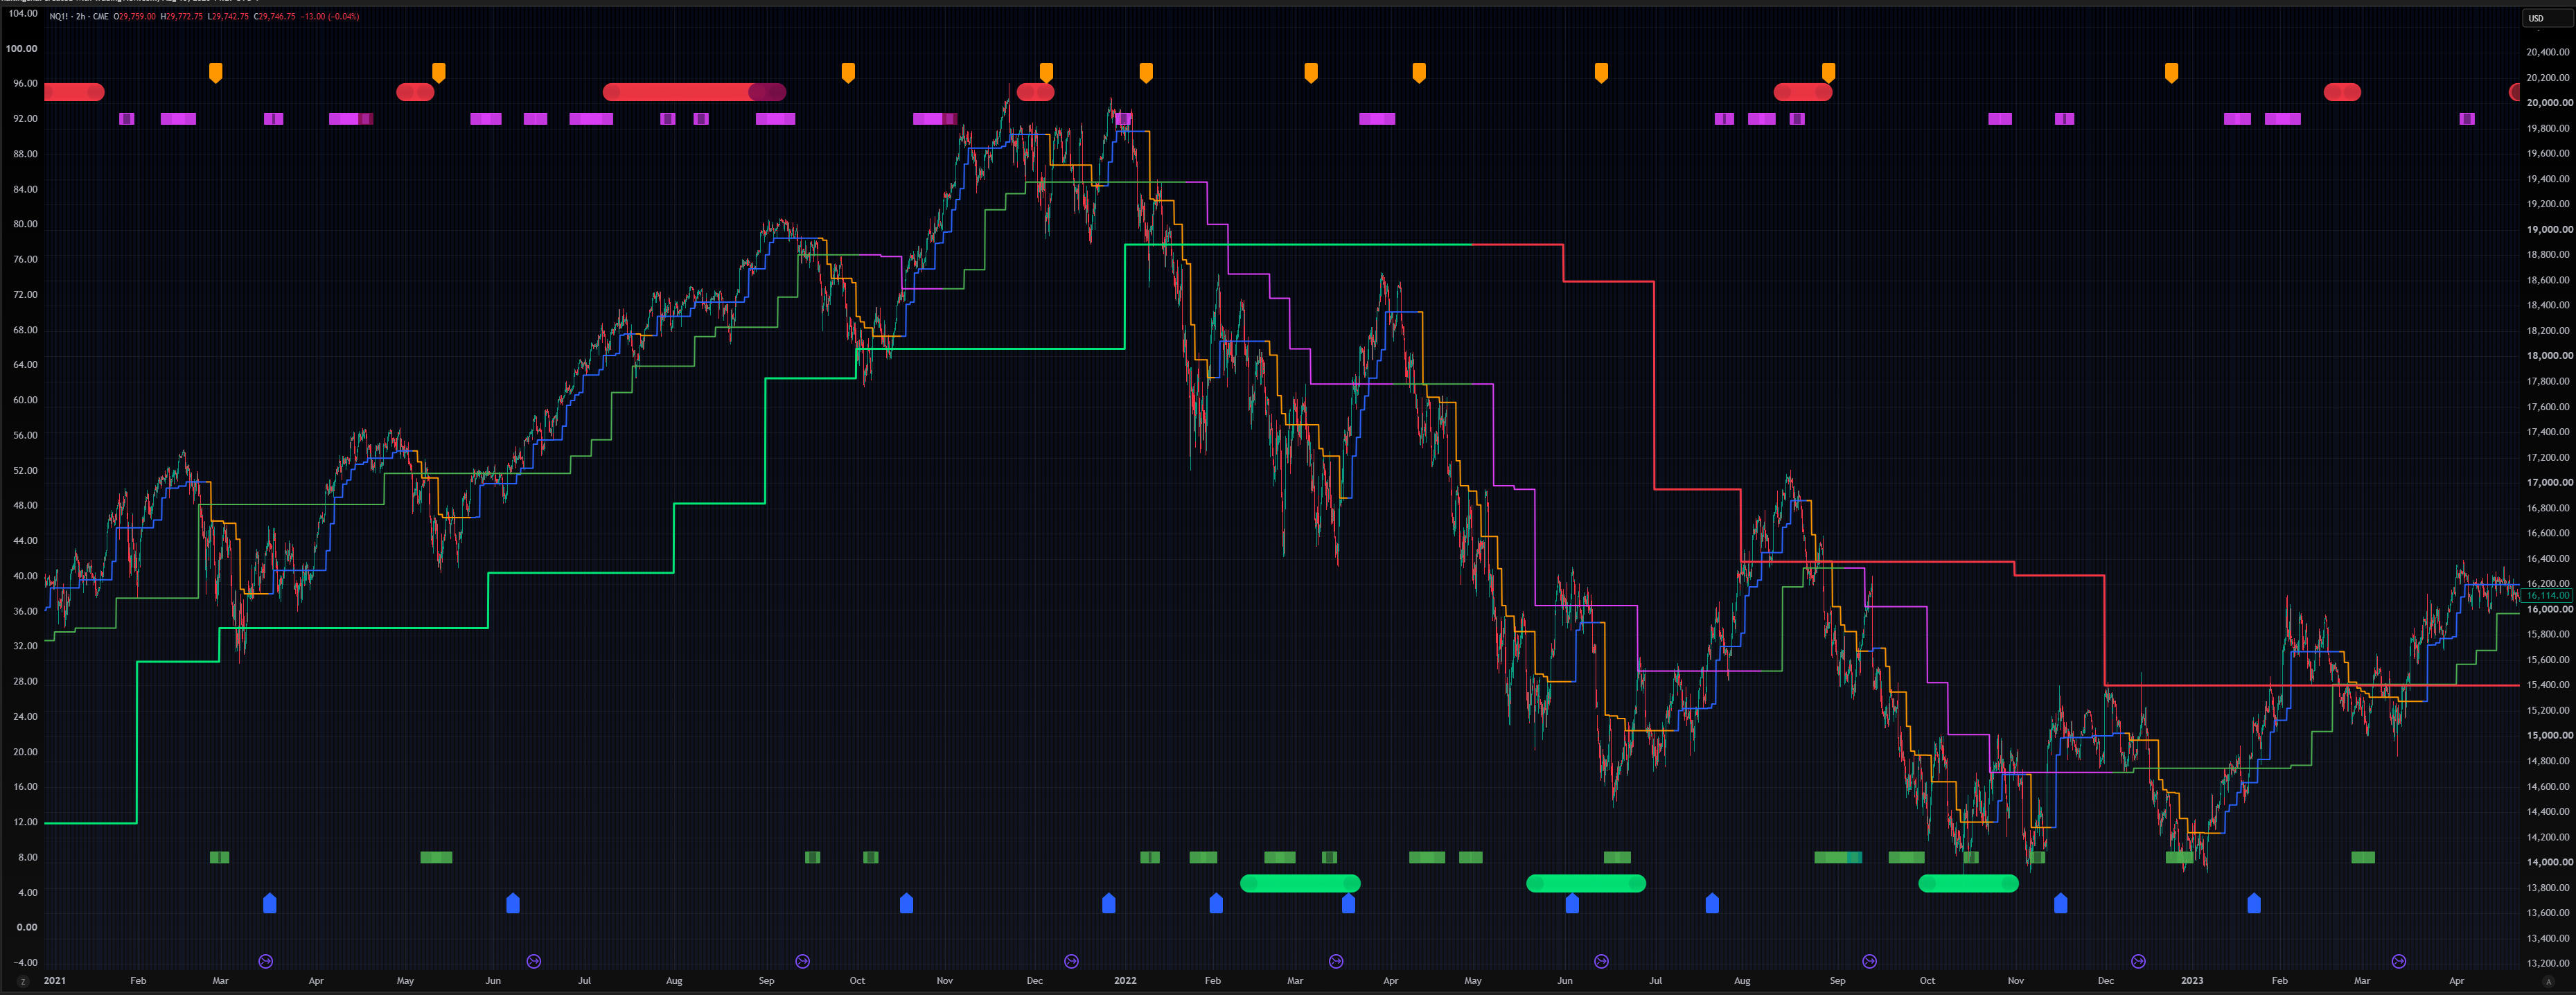
- Example: NQ-2021-uptrend-to-downtrend
Equity Market Downtrend
A corrective equity market downtrend follows the last equity uptrend-sideways cycle. If a major
policy change, a geopolitical event, or a worldwide crisis happens before or during the equity downtrend,
one will likely see:
- VIX spikes and stays at 25 or higher
- Credit spread BAMLH0A0HYM2 spikes
- Potential development into a major bear market
The damage and length of the equity market downtrend vary significantly, so one should become defensive
after the 1D TC Label appears, focusing on day trading
instead of holding positions for many days.
When the 1W SR Line turns 1W SR
Line, it is often followed by steep drops, so one should look for opportunities to short
equities and avoid buying equities until the bottoming process is complete.
When Gold or Bonds have lower volatility than equities during the equity market downtrend, they are a good
alternative to trade.
Sideways Market
Price stops trending and enters a sideways market when:
- Price oscillates above and below the 1W SR Line at the same level many times, and/or
- Changes back and forth between the 1D TC Label and the opposite
1D TC Label
- It can develop into either another uptrend or downtrend leg.
- Example: NQ-2024-sideway-and-2025-sideway

Uptrend Market
In an uptrend market, we will see more
- 4H UD Triangles
- 1D UD Squares
- 1W UD Circles
than
- 4H UD Triangles
- 1D UD Squares
- 1W UD Circles
The stronger the trend, the greater the differences become.
Sequence of Direction Change to Uptrend Market in Higher Timeframes
- Price crosses above 1W SR Line: an early indication that
could flip-flop a lot.
- 1D SR Line crosses above 1W SR
Line: an early indication that could be reversed by the opposing crossover, starting another
leg of the downtrend.
- 1D TC Label appears: an early indication that could be reversed
by the opposite 1D TC Label, starting another leg of the
downtrend.
- Price crosses above 1M SR Line: an indication that the current
downtrend is ending, but this could be reversed if price quickly crosses back below it.
- Color changes from 1W SR Line to 1W
SR Line: an indication that an uptrend is developing.
- Color changes from 1M SR Line to 1M
SR Line: an indication that the uptrend has been confirmed.
- During an uptrend, the 1W SR Line and 1M SR Line become strong
support lines, and price often cannot cross below them. They often act as good entry levels
for long positions.
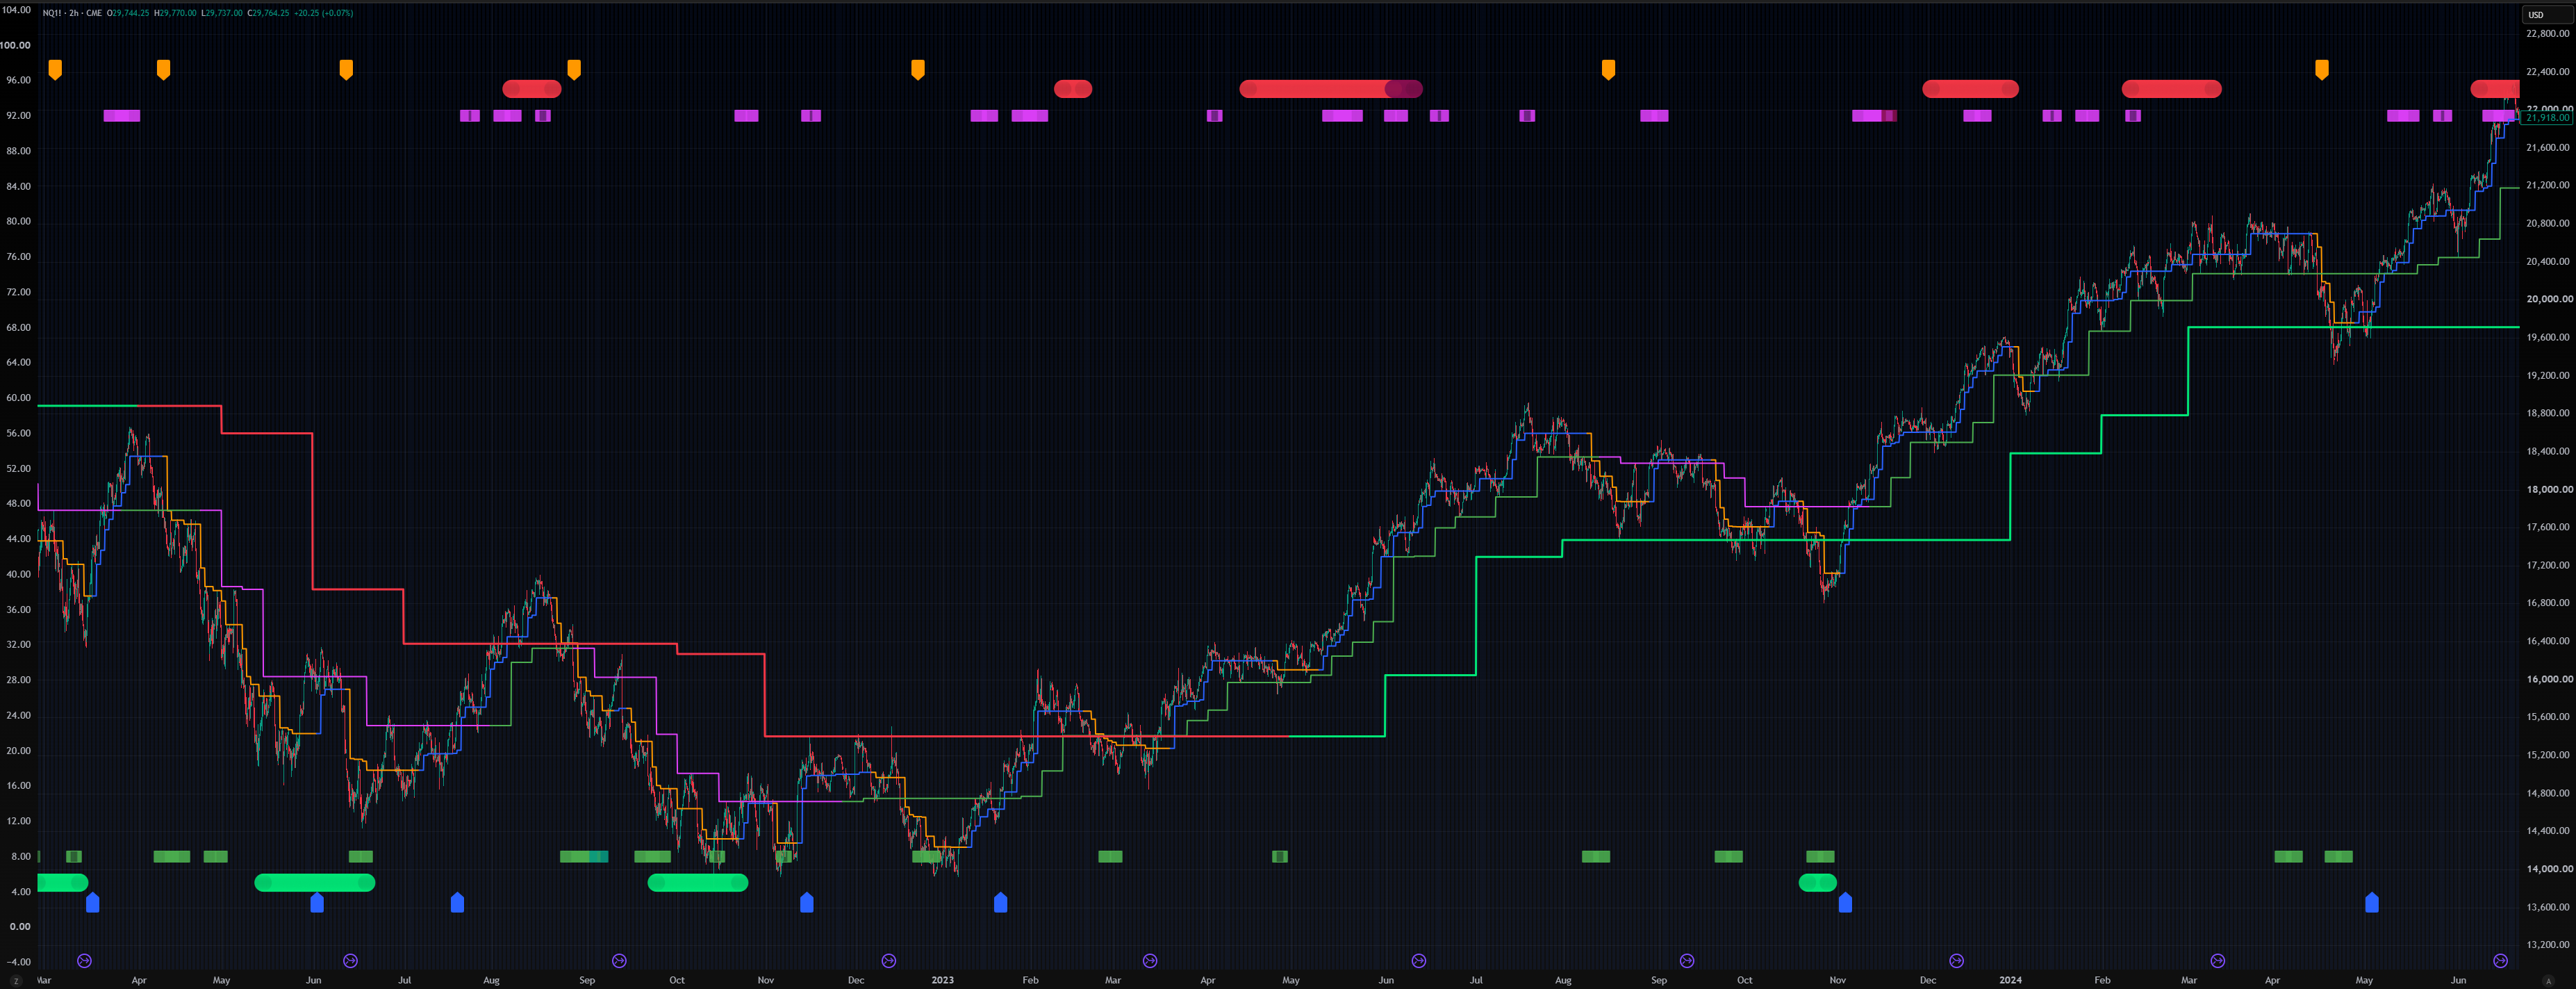
- Example: NQ-2022-downtrend-to-uptrend
Closer Look at Start of Uptrend
- A new uptrend eventually starts after a downtrend.
- It starts with many 4H UD Diamonds and 1D UD Squares.
- A major bear market is typically followed by 1W UD Circles
- The uptrend becomes apparent when:
- On the hourly chart, per ICT concepts, major sell-side liquidity is swept, followed by a
change in state of delivery (CISD), then a market structure shift (MSS)
- Price consistently stays above the 1D SR Line
- Confirmed by a 1D TC Label
- Followed by the 1D SR Line crossing and staying above the
1W SR Line
- Eventually the 1W SR Line turns into and stays as the
1W SR Line
- Example: NQ-2022-closer-look-start-of-uptrend